Sympathy for the devil - The rolling stones
Helping merchants get clarity on business performance
Project Name
Organisation
Year
Role
Business Dashboard (Version 1)
Meesho
2022
Senior Product Designer
#1
Merchants were not able to track hygiene metrics
hygiene metrics were scattered across different sections on the panel leading to lower comprehension of data
#2
Merchants were not sure how to grow their business
Inexperienced merchants on Meesho are not aware of actions to take in order to grow their business
#3
Low awareness about existing growth tools on panel
as a result of the previous point merchants were not sure which actions to prioritise to grow their business on Meesho

problem discovery 🤓
#1
Data
Essential in tracking
day-to-day business function
>
#2
Insight
Help them understand why products underperformed
>
#3
Recommendations
Recommend actions that they can take to improve product performance
>
#4
Action
Nudge them to take the recommended action

We tried to understand their mental model and define a framework which can help them holisticly

project scoping 👀

We realised that this is a two part problem, both of which are complex 😳. Hence we decided to solve for both of them in subsequent versions 😮💨.
☝🏻
Version 1
Provide clarity on business performance
Help merchants understand how their business is performing
✌🏻
Version 2
Guiding with business growth
Help merchants take correct action for business growth
>
📊
Survey Insights
2.9K participants
Top metrics for which they need clarity
47%
Sales and
orders
43%
Views and
clicks
39%
Return
orders
*Merchants could select multiple valid options
What they aimed to do with this information
92%
Identify listings
to improve
56%
Identify high
performing products
📊
Research Insights
#1
Merchants need macro to micro clarity on business performance
The preferred method for them to track the business is to get an overview and further deep dive to understand product performance
#2
They compare multiple metrics to gather insights
Merchants don’t view a metric in isolation rather to get insights they compare multiple metrics
#3
They look at metrics in a business funnel
To understand business performance they look at metrics in a Views > Clicks > Conversions > Returns funnel.


design solution 🧑🏻🎨
Seller Level - Business Overview
Sub-category
Metrics
Rationale
Profit and Revenue
Orders
Sales
Returns
Comparing total orders and sales with returns helps the supplier get a clear idea of total revenue.
Views and Conversions
Views
Clicks
Conversions
These values form activity funnel which allows users to understand performance
Product Level - Performance Overview
Sub-category
Metrics
Rationale
Product
Performance
Views
Clicks
Conversions
Orders
Sales
Returns
Ratings
These values form activity funnel which allows users to understand
product
performance
We wanted to understand metrics and format which mapped to user’s mental model. Based on this we figured that the metrics can be broken down in two categories.
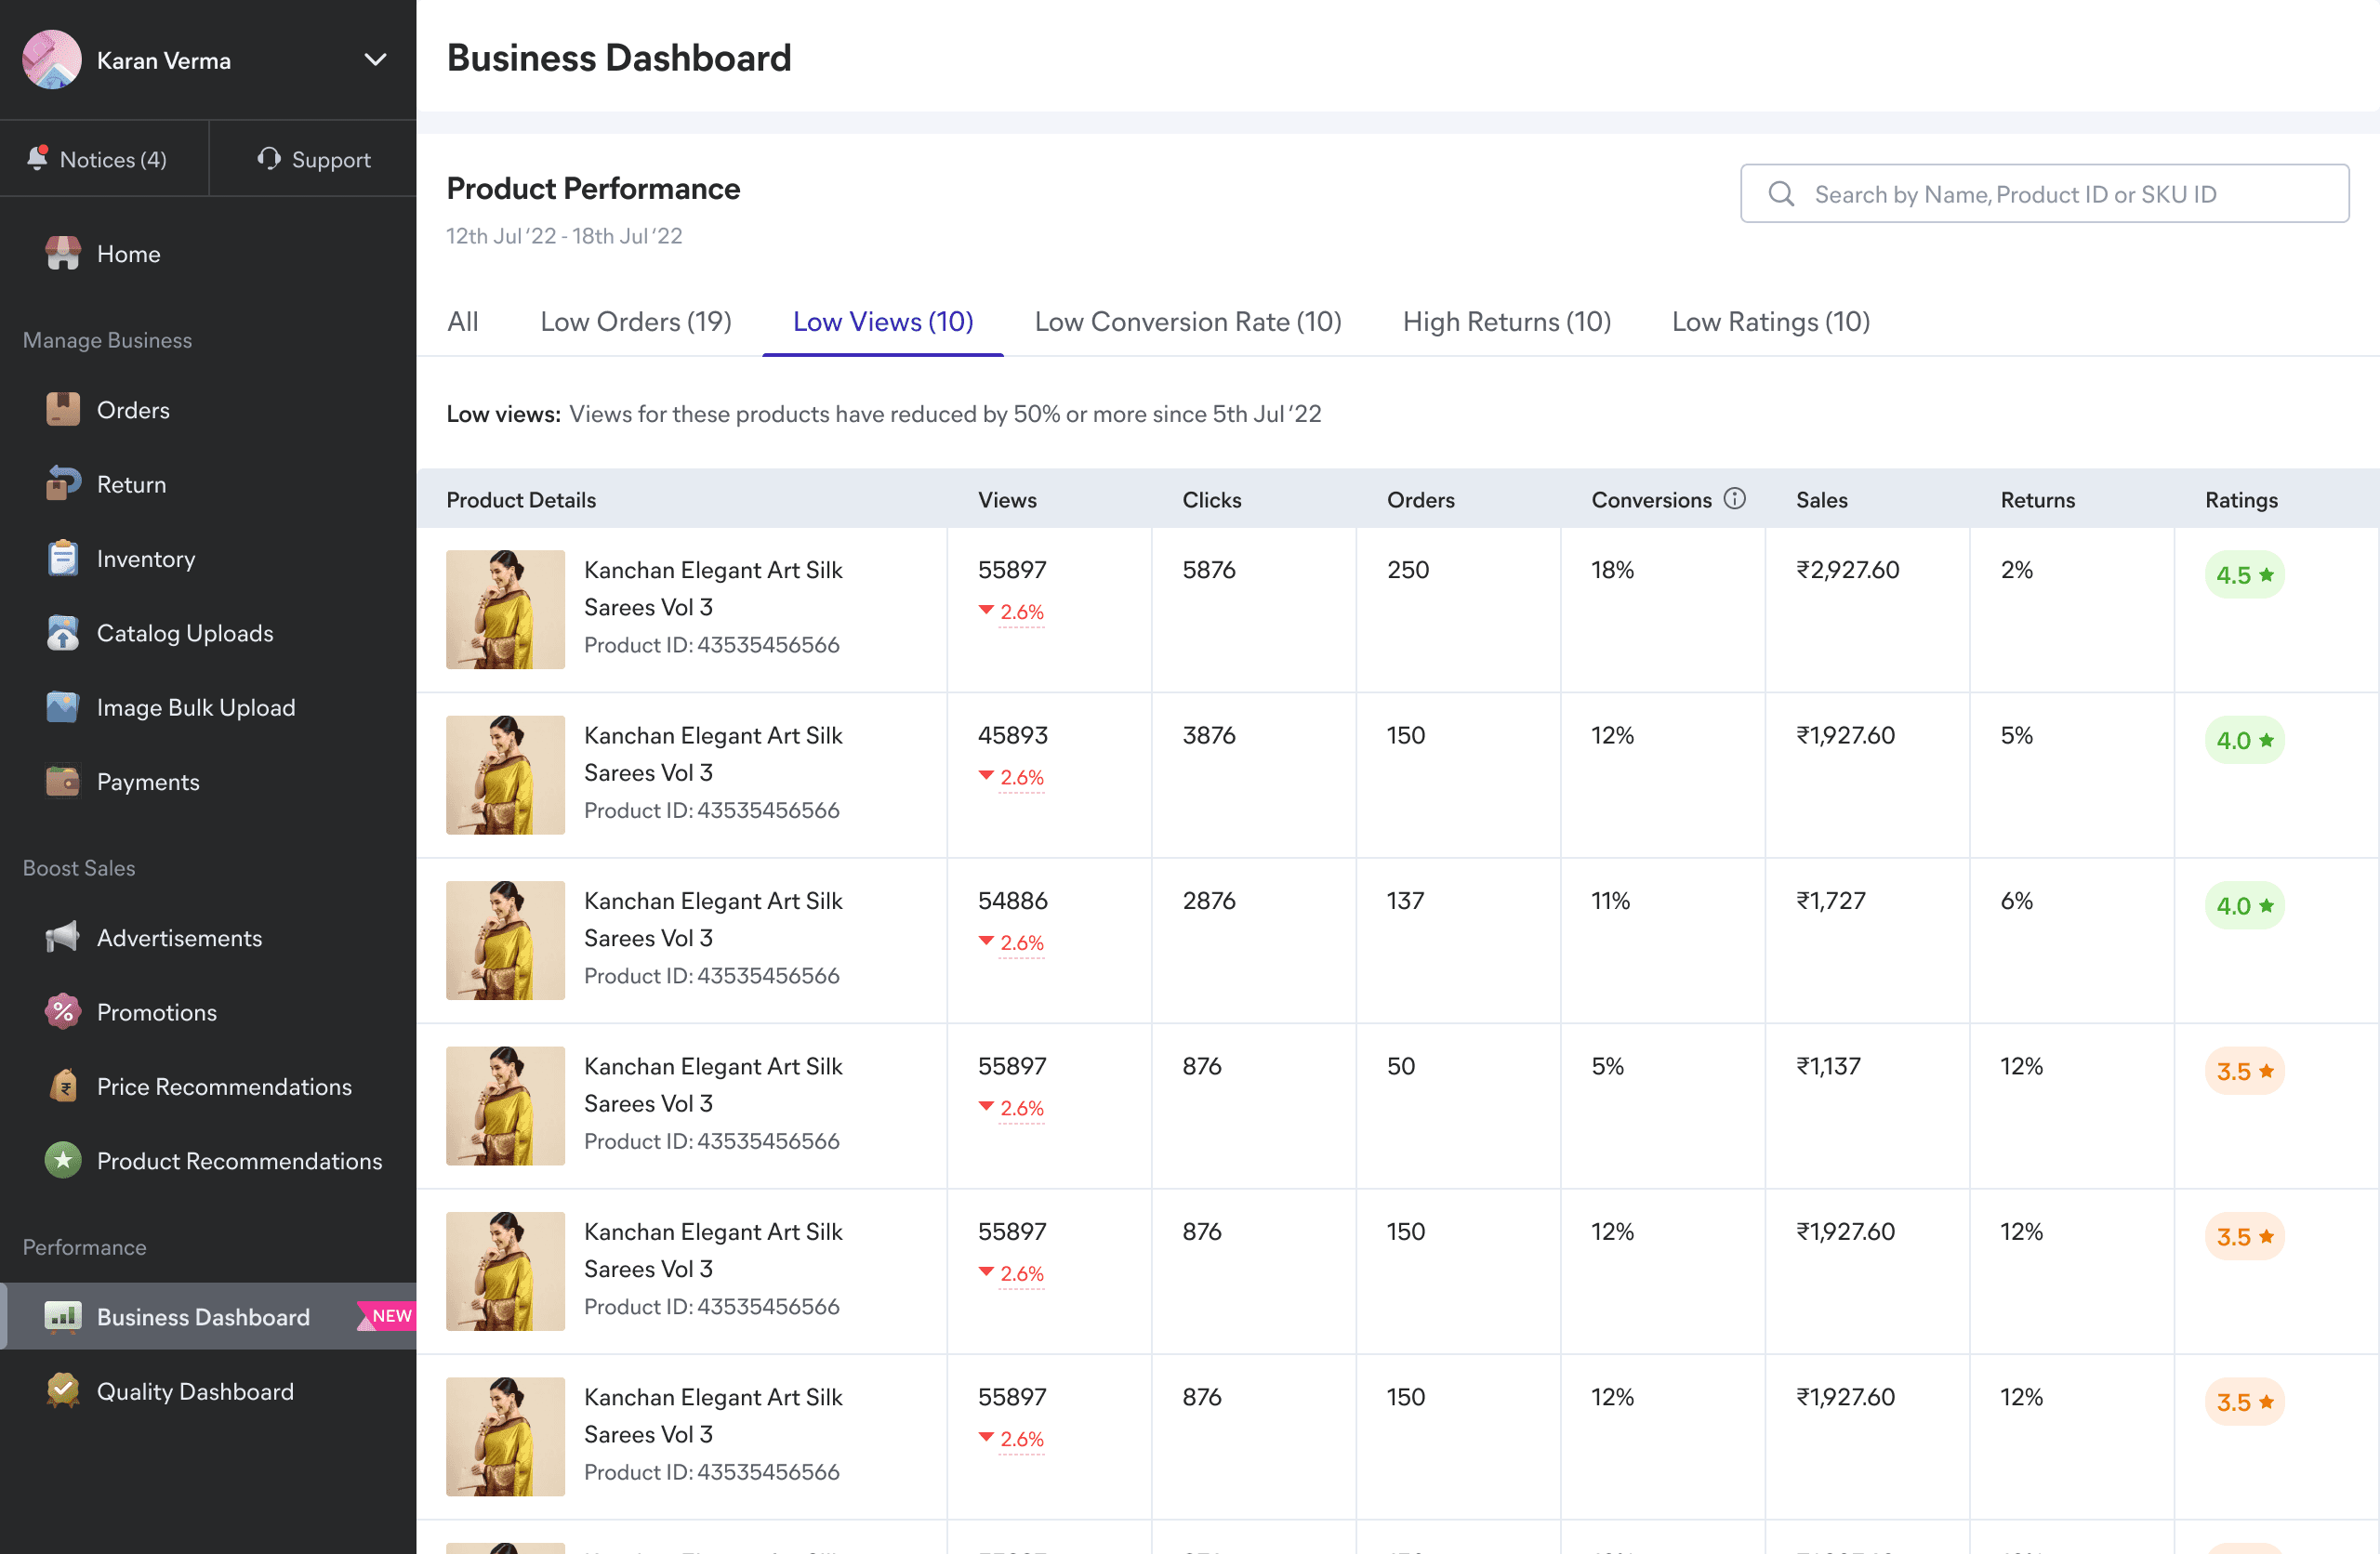
Final Design
Business Dashboard - Version 1
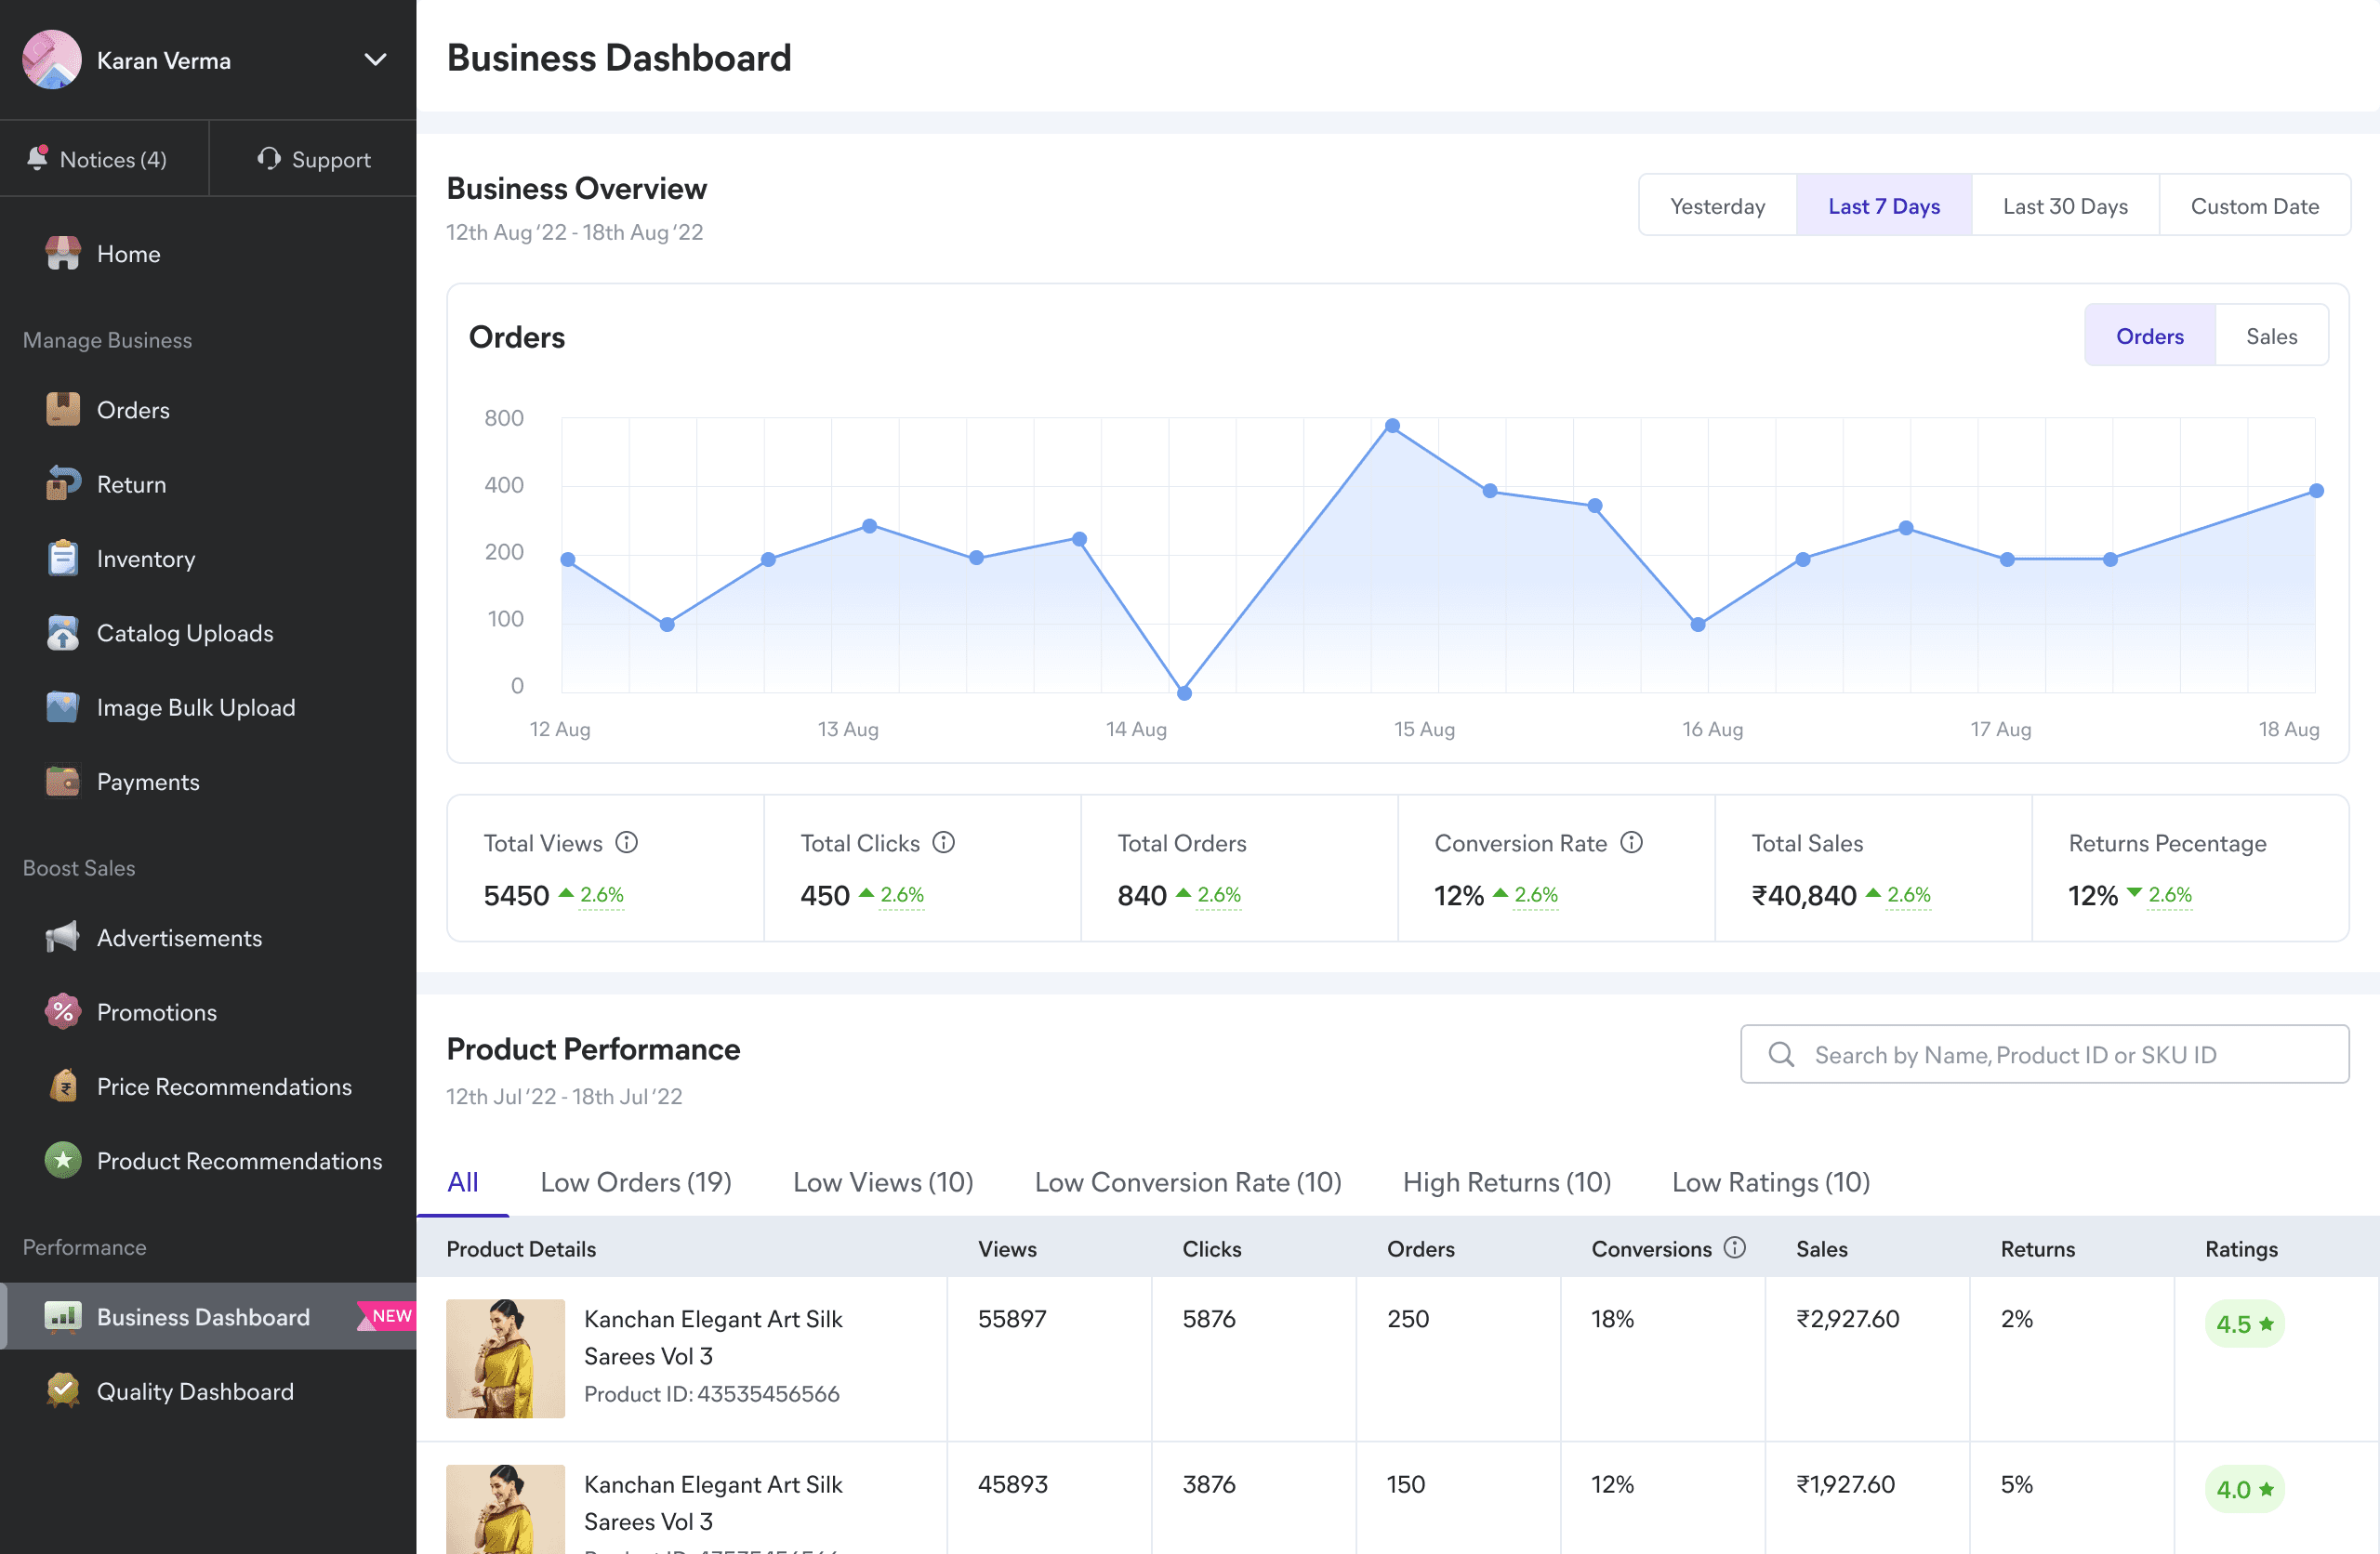
☝
Business Overview
Merchants can see an overview of their business performance trend for the selected time period.
They can also view other relevant metrics in a format which maps their mental model.
✌
Product Performance
Merchants can see how all their products are performing in the last 30 days.
They can also see which products might be underperforming w.r.t. to any growth metric.
video testimonials 📼
We were able to collect qualitative feedback through user callings and the reception was great. Fortunately a few of them have also created video testimonials and shared it on their youtube.